Almost immediately after the election, people started noticing pages disappearing from federal government websites. Some of this is par for the course in a new administration. Of course the Trump administration cleaned out the Obama-specific pages on whitehouse.gov and started with a clean slate. So did Obama.
But in many ways, this seemed to be different. At the same time that whitehouse.gov was changing, Washington was instituting social media gag orders and forbidding employees from talking with the public or the press about their agency’s research. And then people started noticing pages disappearing from websites that don’t usually change much when a new administration takes over: usda.gov, ed.gov, … And one of the more conspicuous deletions ― idea.ed.gov, a site dedicated to helping teachers, students, and parents navigate the Individuals with Disabilities Education Act (now back up) ― just happened to come a day after Betsy DeVos was confirmed as Secretary of Education. The same Betsy DeVos who didn’t know that IDEA was federal law and would prefer that states and districts exercise their own judgment when dealing with disability-related issues.
As this news started to break, I was already looking for a new research project. Preferably one that would allow me to use (and hone) my skills as a data scientist in service of the public good. So I decided to start scraping, spidering, mining, and analyzing federal government websites, looking for additions, changes, and deletions, and comparing the content of these websites with their Obama-era counterparts. I’m still developing the code for some of that project, and figuring out how I can store and manage all the data that I want to collect. But I’ve got a good start on whitehouse.gov and ed.gov, with more news on that coming soon.
In the mean time, I found a really great tool from the Internet Archive’s Wayback Machine. The Wayback Machine allows anyone to view old versions of websites. They crawl and scrape large swaths of the web on a regular basis, and as long as their scraper collected the data, anyone can view it. While for sites like my own blog, a lot of changes go unnoticed by the Wayback Machine, federal government websites have been scraped regularly from the very beginning, often crawled multiple times per day looking for updates, so it’s a fairly reliable source, and definitely the best we have.
The ability to go to archive.org and search millions of websites from the past 20 years is amazing. But for big-data research, there’s an even better tool: their API. In particular, I’ve found their CDX Server API to be an amazing tool when studying changes in a website over time. You feed it a query (just a simple URL string, no authentication needed), and it returns the entire change history for all of the snapshots in the Wayback Machine archive for a domain. Want to download a single text file containing all of the additions and changes on ed.gov discovered by the Wayback Machine in the past 20 years? No problem. Just open a browser, type in
http://web.archive.org/cdx/search/cdx?url=ed.gov&matchType=domain&output=json&collapse=digest
and wait for a minute. When the page finishes loading, click save. Now you’ve got it! The entire history of page additions and changes for the domain whitehouse.gov and all its subdomains found by the Wayback Machine, with any duplicate pages found in successive snapshots collapsed into single entries.
There’s one catch: the Wayback Machine is focused on finding old versions of pages that have since been changed or deleted. It does not preserve an easy-to-query history of page deletions. And while it’s possible to ascertain that information from a spider crawl of the entire archive, their server (purposefully?) makes that a slow process. Given the size of these archives, it would take days. So an analysis of page deletions will have to happen another way.
With that caveat in mind, I wrote an R script that will query the change/addition history for six federal agency websites (whitehouse.gov, ed.gov, fcc.gov, epa.gov, usda.gov, and nps.gov) as well as several retail, journalistic, and non-profit organization websites to serve as a baseline comparison. What I found was mind-blowing. In fact, I’m still not sure I believe it. But here goes…
The 20-year history
The first thing I did with this data was plot out the changes over time. The following image shows the number of page changes/additions per month for each of the six federal websites I analyzed. Notice anything?
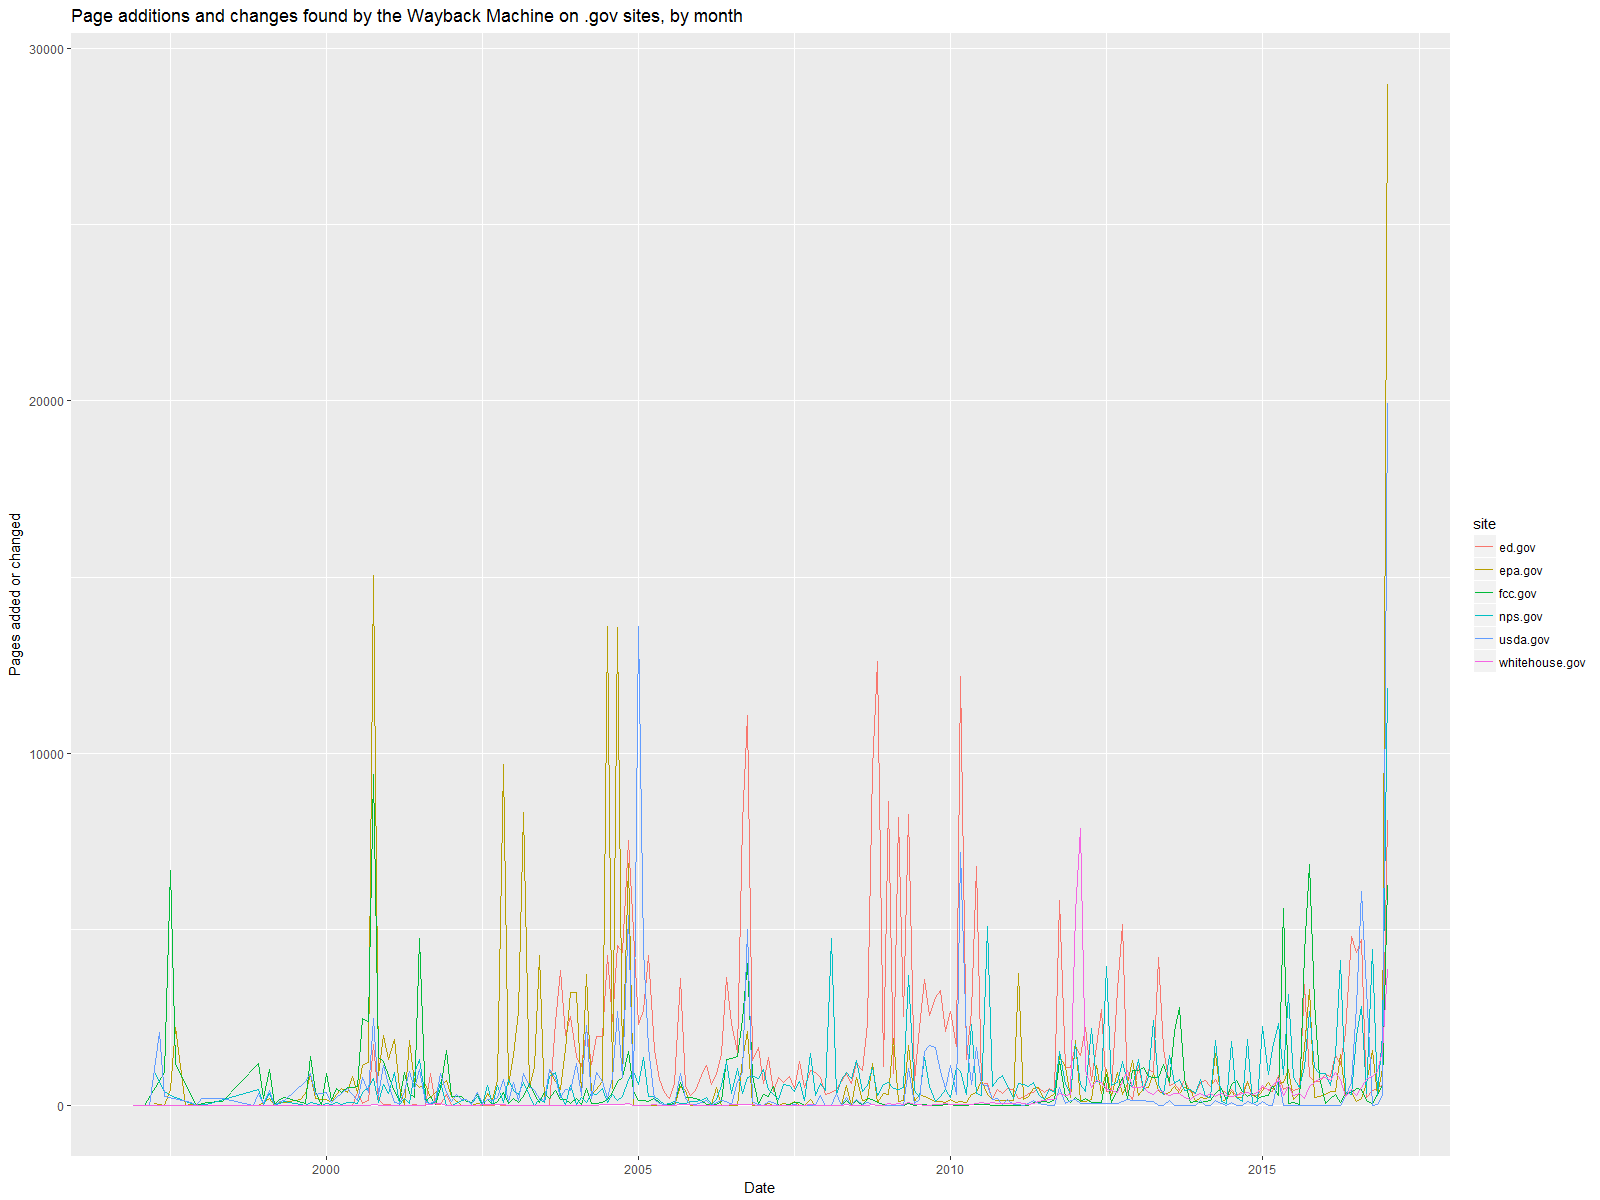
That spike at the end? That’s January 2017. Wow.
Now, a few things could be happening here. It could be indicative of the changes that usually accompany a new administration. But if we look to January 2001 and 2009, there is no comparable spike. There are local peaks at the beginning of Bush’s and Obama’s administrations, but nothing like Trump’s.
So I thought there might be a change in how the Wayback Machine takes its snapshots. Maybe it’s just taking that many more snapshots now, so it catches all the little changes in 2017 that would have been combined into fewer, but more substantive, changes found by the Wayback Machine in 2001 and 2009. When you visit a page on the Wayback Machine, there is a discernible increase in snapshots over time. But is it this big and this precipitous?
The simplest way to test that was to examine change histories for non-government websites. So I queried the change history of seven retail, non-profit, and journalistic websites that update at a variety of frequencies ― washingtonpost.com, theguardian.com, npr.org, aspca.org, societymusictheory.org, psychologytoday.com, and target.com. Here are their change histories:
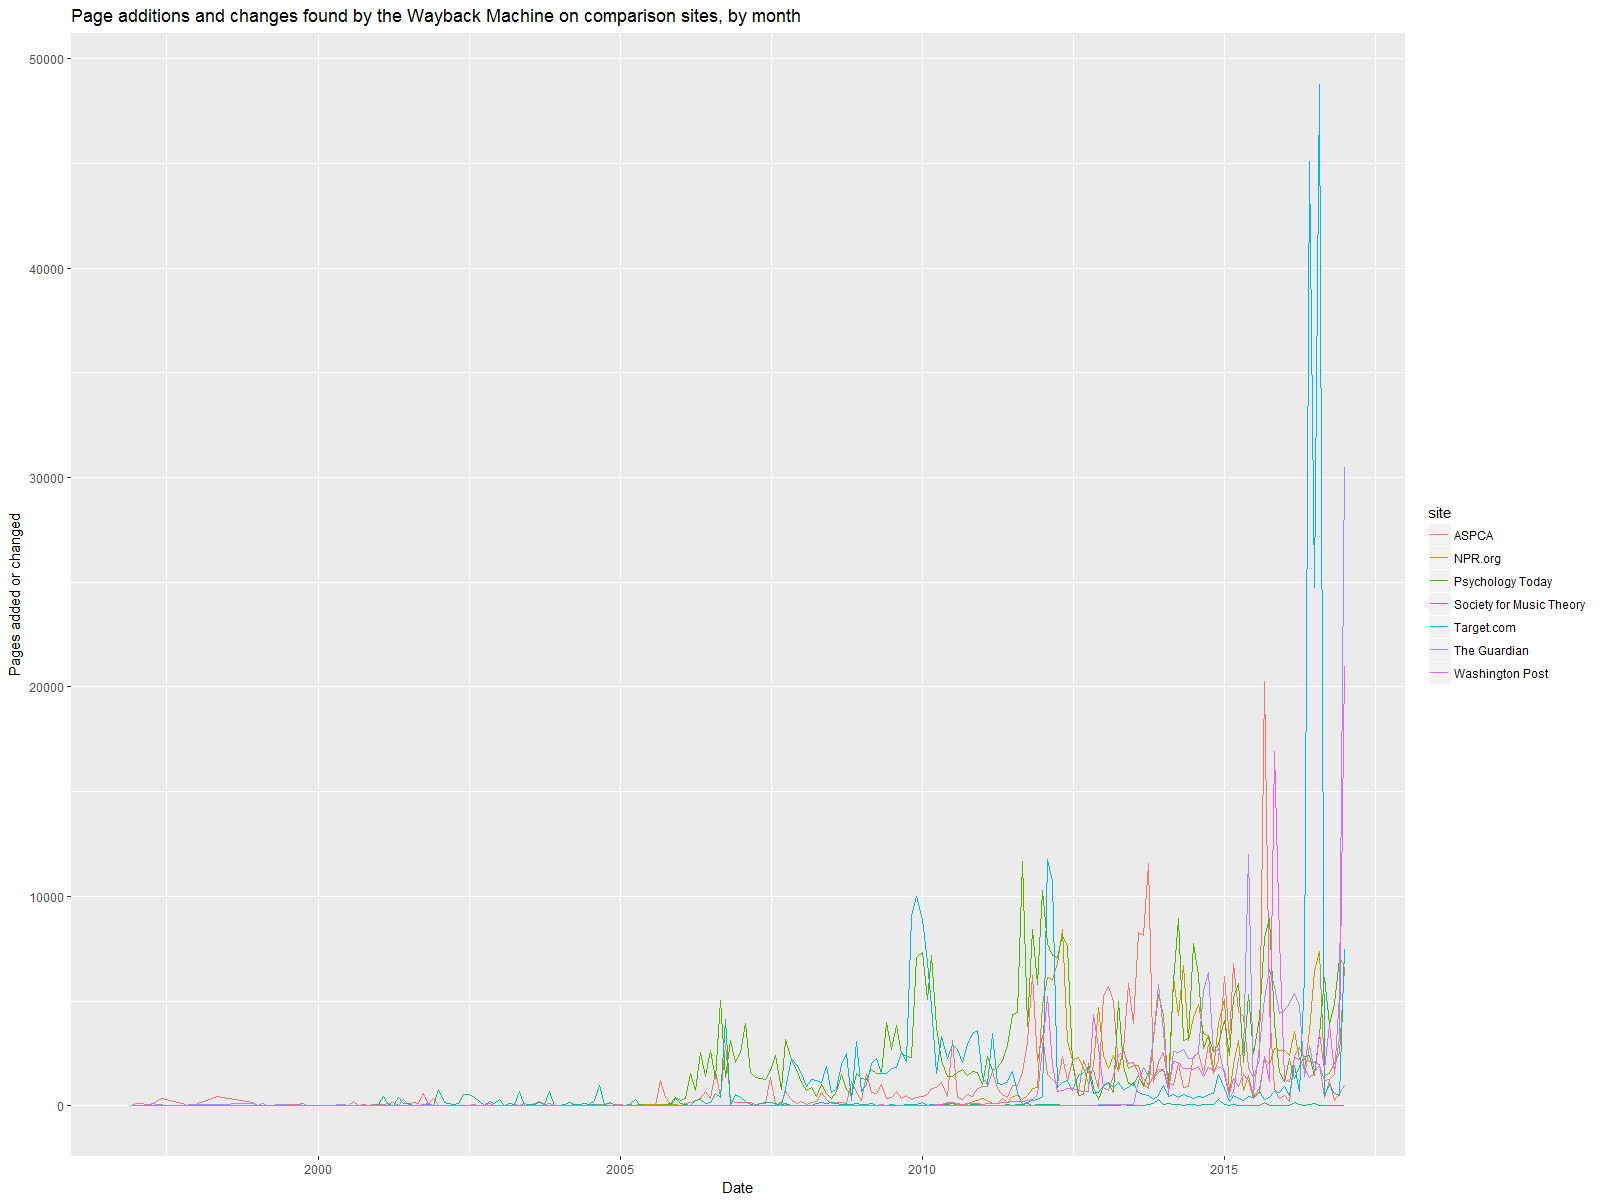
These sites actually reflect something more like the general trend of increasing snapshots over time than the .gov websites do (as well as an apparently major site overhaul on Target.com last summer!). But with the exception of Washington Post and The Guardian (which spend much of their time covering government activity), there is no major spike in early 2017.
So as far as I can tell, the increase in .gov site changes in early 2017 is not an artifact of changes in the way the Wayback Machine crawls the web. And it’s huge. But maybe it’s not just Trump? Maybe Obama’s agencies were making a lot of changes at the end of the administration, too?
Here’s a day-by-day breakdown of changes from January 1 to February 15, 2017. It’s pretty clear that the bulk of the changes come after the inauguration.
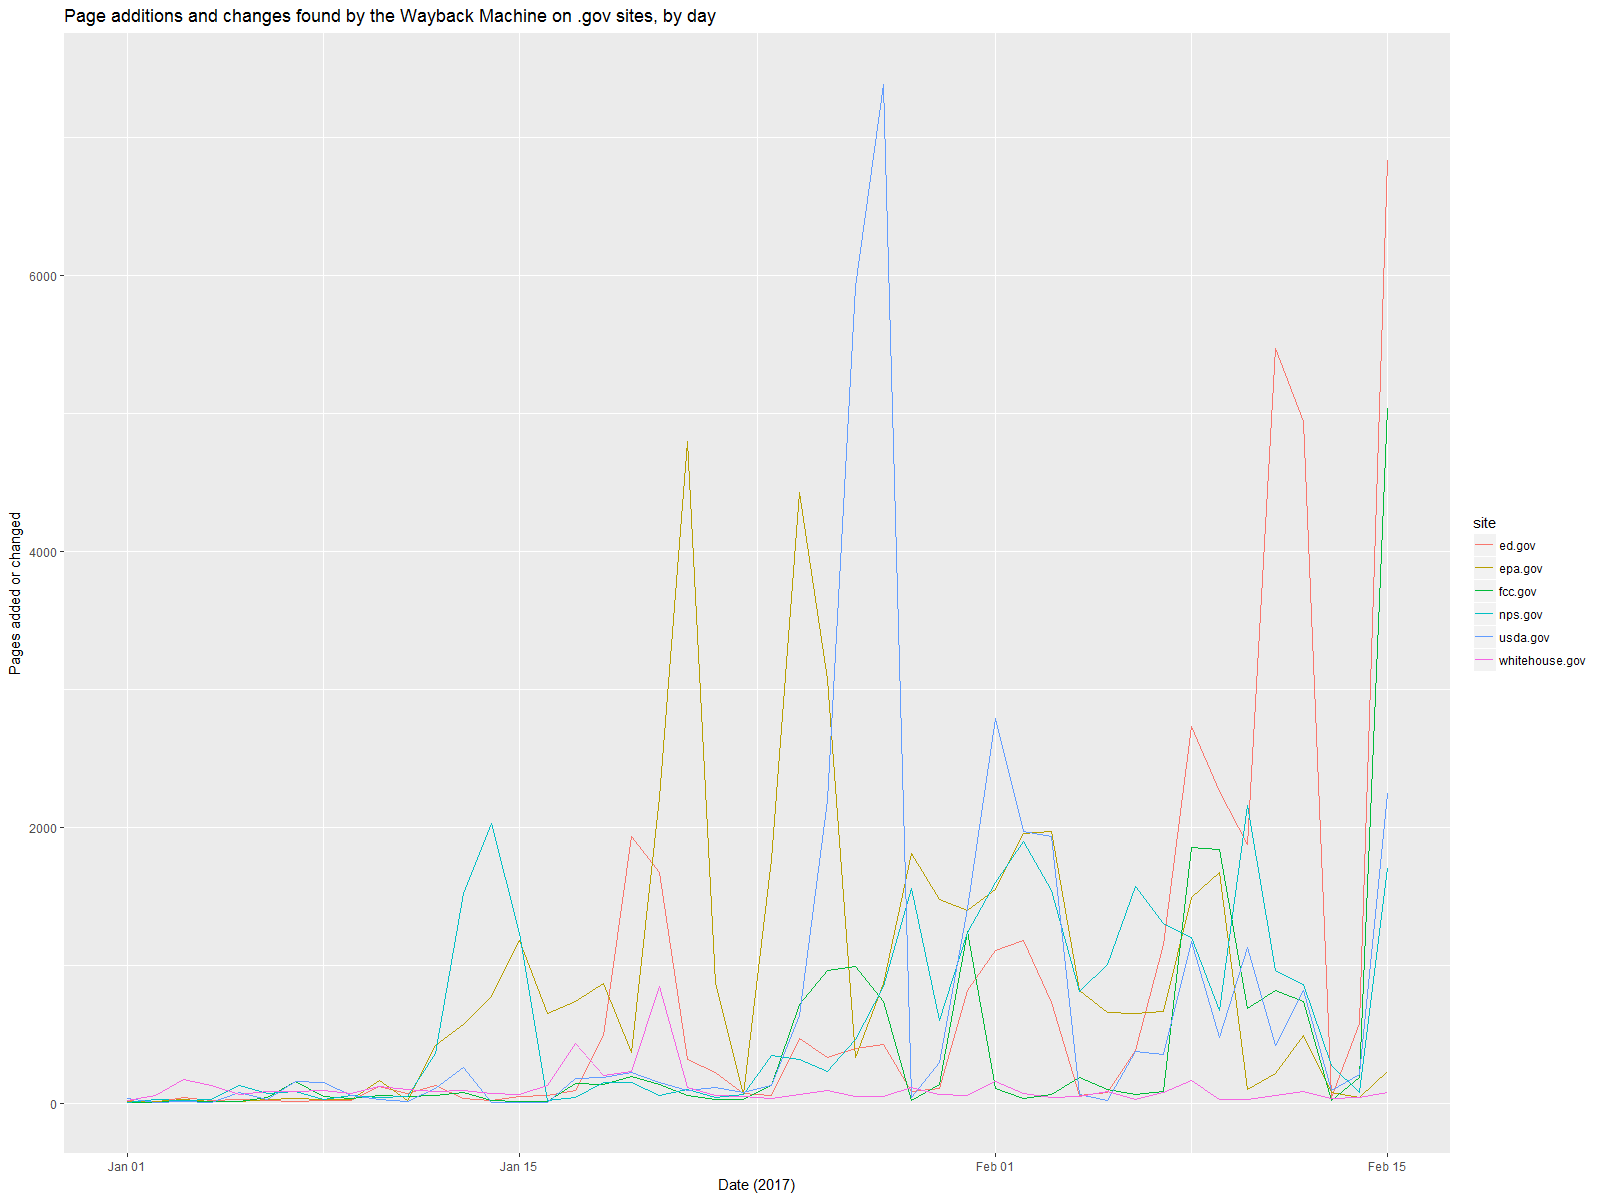
The non-government websites do not show such a change, even the journalistic ones.
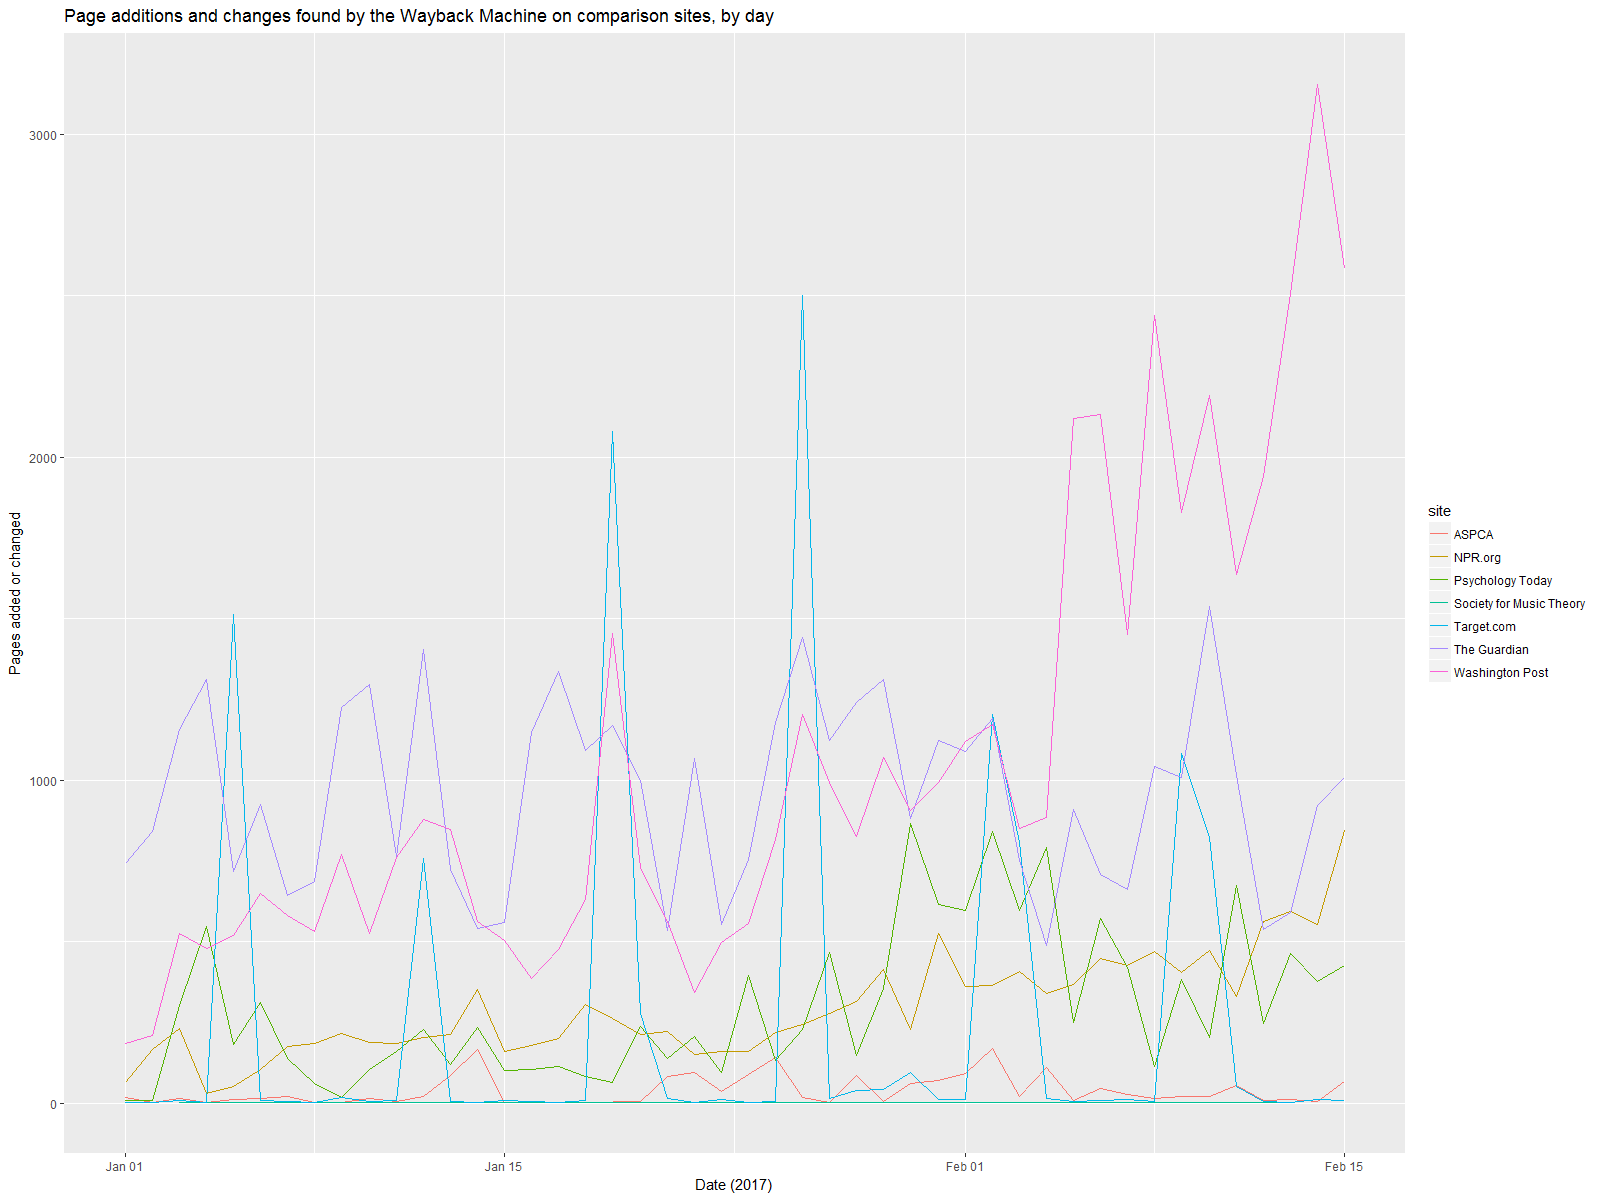
So the best explanation I can come up with so far is that the Trump administration is making major additions and changes to federal agency websites. There’s still the possibility that these are many small changes, rather than large changes. To explore that requires a more detailed study of larger downloads of data from those websites. (And I’m working on that, too!) But something has definitely changed about how the federal government communicates information to the public digitally. And taken together with the gag orders, the misdirection from the press secretary, and the page deletions already documented, this is major. Our federal government is changing the way it communicates with us, it is not being transparent about those changes, and it becomes more likely with each passing day that important information is being withheld.
This is a problem.
Content types
In addition to adding, deleting, and changing content, the Trump administration is making major changes to the types of content on .gov sites. The most common file types in the .gov dataset overtime are HTML (regular web pages), PDF documents, plain text, JPEG images, and Microsoft Word documents, with HTML documents comprising 60% of the pages in the .gov dataset. When it comes to engaging information on the web, HTML and plain text are the most accessible and the most versatile, with Word documents and especially PDFs being more difficult to work with. (You may think everyone has MS Word and a PDF reader, but the added layers of browser plugins, downloads, and the tax-form-like formatting of many of these PDFs make them significantly less user-friendly than a well designed web page. Think IRS.gov.)
Not surprisingly, the past few weeks have seen a significant change in file type. Here is a change history of these six .gov websites, separated by file type instead of by site.
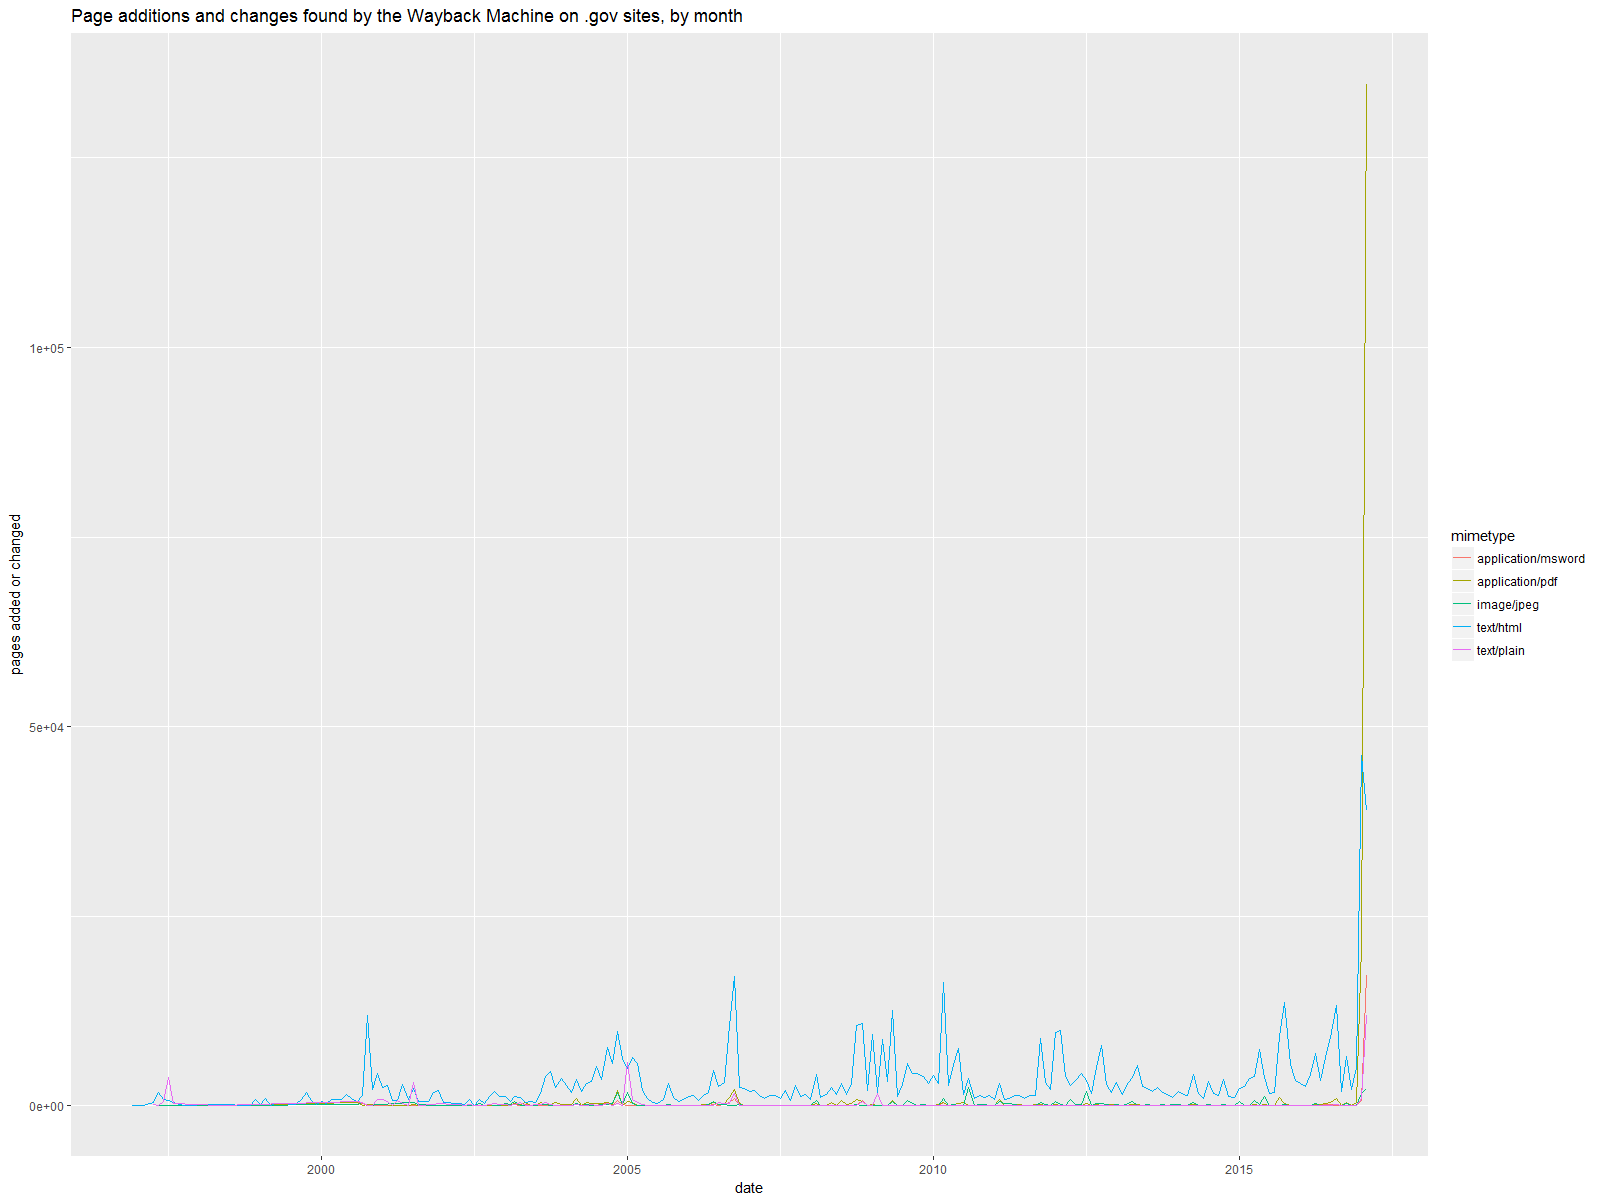
While HTML files go up in January 2017, they are far outstripped by PDFs, and their rate of increase is outstripped by Word docs. In fact, January 2017 brought 134,733 of the 185,468 PDFs in the history of these websites (73%!) and 17,149 of the 26,772 Word docs in the sites’ history (64%). On the other hand, January 2017 saw 38,881 new or changed HTML pages, just 5% of the 725,119 in the whole dataset.
This is further evidence that the Trump administration is obfuscating information. Delete important content, make drastic changes to existing content, replace user-friendly web sites with PDFs and Word documents, pull back on social media usage, limit federal employee access to the press, and leave the press’s inquiries unanswered by the press secretary.
A harrowing picture
In the weeks to come, I’ll be refining my software and statistical models to look in more depth at specific content changes on some of these sites. But even this “distant read” paints a harrowing picture of our current government’s approach to information. It’s not surprising given the media history of Trump and several of his top advisors. But it’s incredibly dangerous.
What can we do? To start, we can support the efforts of the Internet Archive, especially as they pursue plans for a mirror outside the United States. We can keep a close eye on these government sites, looking at which domains, subdomains, and pages are changing the most frequently. We can draw attention to particularly problematic deletions, additions, and changes. We can mirror and share data elsewhere on the web. And we can demand transparency from others in government who are in position to counter this trend from the Executive Branch.
I’ve decided to spend time and energy setting up tools to accomplish some of these things, particularly the watching and the analyzing. It’s something I can do to help, and hopefully it will prove valuable. I’ll keep posting regular updates, and please check out my whitehouse and websitewatcher repositories on GitHub if you want to run the code for yourself or contribute to the project.
Header image by Kaboompics.