I created a series of tutorials for my Computational Music Analysis students this summer, introducing them to basic analysis and visualization of musical data in RStudio. RStudio is a powerful, free tool for statistical analysis, and these tutorials are based on datasets from recent publications in music theory and analysis: the McGill Billboard Dataset, Trevor de Clercq and David Temperley’s Rolling Stone corpus, and a subset of the Million Song Dataset (with lyric and genre tags).
If you’re interested in learning statistical analysis of musical data, getting more comfortable with RStudio, or just want some fun datasets to play around with, check out the resources below.
Note: if you don’t use R, you can still download these datasets and play around with them in Excel, or write your own scripts in Python, Perl, or other language of your choice. It’s simply a platform-independent, plain-text spreadsheet file.
Learning the basics of R - summaries and plots with the Rolling Stone corpus

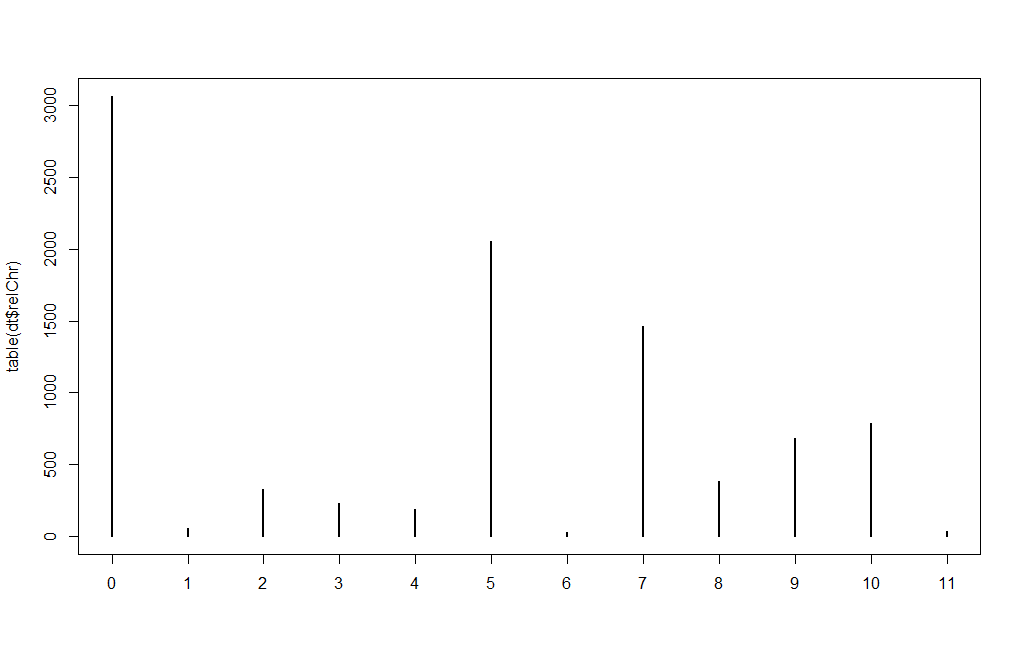
Frequency of chord root in Temperley’s Rolling Stone analyses. Integers on the X axis represent number of semitones above the song’s tonic pitch.
This tutorial is built around a cleaned up version of David Temperley’s harmonic analyses of 100 ‘rock’ songs for a 2011 article he co-authored with Trevor deClercq: “A corpus analysis of rock harmony.”
Here is the data file.
And here is the R script file.
Assuming you have RStudio installed, simply download the two files to the same folder, open the R script in RStudio, and follow the instructions in that file. You can run each individual command by selecting the line and clicking ‘run’. Or ― since each command is a single line ― you can simply place your cursor anywhere on the line you want to run, and then press CMD-Return on a Mac or CTRL-Enter on Windows (and probably Linux).
Data clean-up, tables, and more plots with the McGill Billboard Dataset

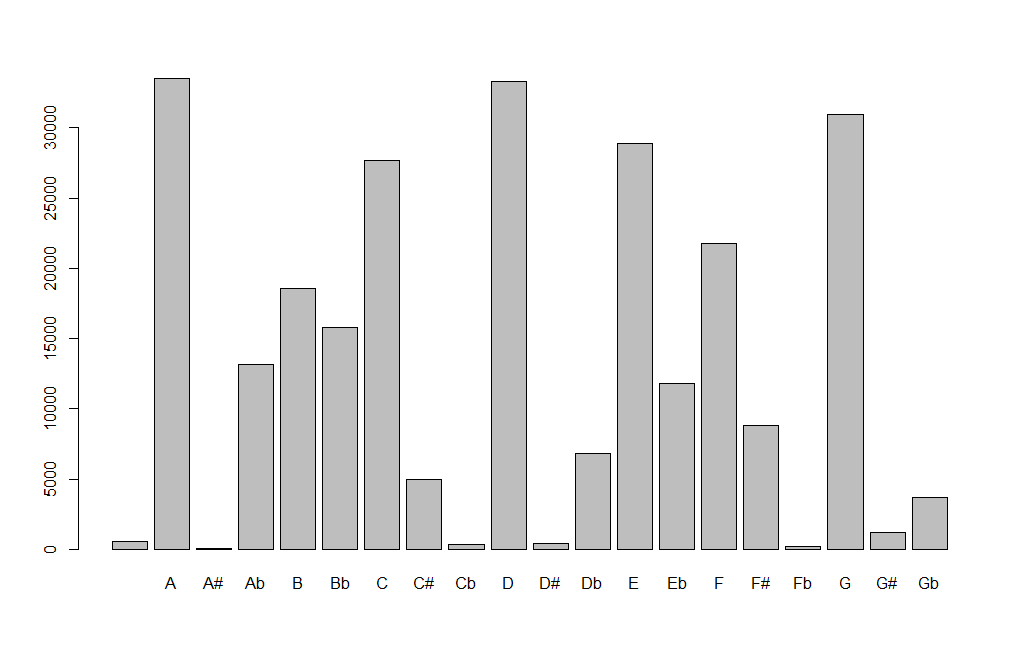
Frequency of chord roots in McGill Billboard dataset.
This tutorial follows on the Temperley/de Clercq tutorial, and is built around the data from the McGill Billboard dataset (version 2.0). The McGill Billboard dataset contains information about chords in over 700 songs from the Billboard Hot 100 lists from the late 1950s to the early 1990s, along with timing information and metadata. However, the dataset does not include things like chords roots relative to the tonic of the key, which though easily calculated, makes things easier to analyze when included explicitly. So we added that. We also had to clean up some errors in the source file. This R script walks through that process, so you can get some experience with an aspect of data cleanup. (And if memory serves me correctly, leaves in a couple errors for users to find and correct following the same methods.)
Here is the data file.
Here is the data file post-cleanup.
And here is the R script file.
Assuming you have RStudio installed, simply download the two files to the same folder, open the R script in RStudio, and follow the instructions in that file. You can run each individual command by selecting the line and clicking ‘run’. Or ― since each command is a single line ― you can simply place your cursor anywhere on the line you want to run, and then press CMD-Return on a Mac or CTRL-Enter on Windows (and probably Linux).
Correlation, Chi-Squared, and ANoVA tests with the Million Song Dataset

ANoVA for the association of genre song duration in the Million Song Dataset subset.
This tutorial goes into more detail regarding data prep and statistics, based on a subset of songs from the Million Song Dataset, and corresponding lyric and genre data from musixmatch database and the Tagtraum genre annotation database. This tutorial walks through the process of combining the musical data from the MSD, with the user-generated genre tags from Tagtraum and the results of a (preliminary) topic model analysis of song lyrics.
For more details on the content of this subset of the MSD, see A Closer Look at the Million Song Dataset and Looking at Song Genres, Release Year, and Time Signature.
Here is the MSD data file.
Here is the genre and lyric data file.
And here is the R script file.
Assuming you have RStudio installed, simply download the two files to the same folder, open the R script in RStudio, and follow the instructions in that file. You can run each individual command by selecting the line and clicking ‘run’. Or ― since each command is a single line ― you can simply place your cursor anywhere on the line you want to run, and then press CMD-Return on a Mac or CTRL-Enter on Windows (and probably Linux).
Further exploration
If you want to follow up with some other datasets and play around with them in a statistical analysis package like R, check out the corpusmusic organization on GitHub that I set up for my collaborative research projects and those of my students. You’ll find the source data and the code used to generate or clean it for the above tutorials, as well as some other interesting projects, some of which are ongoing.
Have fun!